Maciej
Pandas + Scikit workflow
Ever since I started doing machine learning I was torn apart between Python and R. R is extremely easy at the beginning and you might create a simple model in a matter of minutes.
Python + Scikit + Pandas has definitely steeper learning curve. At this point, I prefer Python over R as I find more explicit. It’s harder but if you use it properly it’s simpler once you start doing something more serious as different libraries tend to play together well.
I will present here how I prefer structuring my explorative Python scripts using Pipeline, sklearn.preprocessing.*, Pandas dataframes and sklearn-pandas bridge library.
If you want to play with the code, go ahead and download the .ipynb source of this blogpost.
Preprocessing
Let’s go through an example from Kaggle, the Titanic dataset. The task here is to predict who will survive on Titanic, based on a subset of whole dataset.
What I care about is to do as much data preprocessing as possible in Pandas as it’s easy to validate the results of it and unlike using numpy, you can manipulate the data based on column names instead of column indexes. A byproduct of that is, that you arrive at a R-ready dataframe and you can e.g. do some explorative analysis using ggplot2.
If you wish to see the gist only, go directly to the first usage of Pipeline.
from __future__ import division
import csv as csv
import numpy as np

import pandas as pd

from sklearn.ensemble import RandomForestClassifier
from sklearn.cross_validation import KFold, StratifiedKFold, cross_val_score
from sklearn.pipeline import Pipeline
from sklearn.linear_model import LogisticRegression
from sklearn.grid_search import GridSearchCV
from sklearn.preprocessing import LabelEncoder, LabelBinarizer

from sklearn_pandas import DataFrameMapper
Let’s load the data from Kaggle Titanic competition.
df_train = pd.read_csv('train.csv', header = 0, index_col = 'PassengerId')
df_test = pd.read_csv('test.csv', header = 0, index_col = 'PassengerId')
df = pd.concat([df_train, df_test], keys=["train", "test"])
I concatenated df_train and df_test above.
This simplifies dealing with any with missing data, creating new features and such as I do it once for the whole dataset.
Note also the index_col argument - this tremendously helps when performing merges.
df['Title'] = df['Name'].apply(lambda c: c[c.index(',') + 2 : c.index('.')])
df['LastName'] = df['Name'].apply(lambda n: n[0:n.index(',')])
df['FamilySize'] = df['SibSp'] + df['Parch'] + 1
df.loc[df['Embarked'].isnull(), 'Embarked'] = df['Embarked'].mode()[0]
df.loc[df['Fare'].isnull(), 'Fare'] = df['Fare'].mode()[0]
df['FamilyID'] = df['LastName'] + ':' + df['FamilySize'].apply(str)
df.loc[df['FamilySize'] <= 2, 'FamilyID'] = 'Small_Family'

df['AgeOriginallyNaN'] = df['Age'].isnull().astype(int)
medians_by_title = pd.DataFrame(df.groupby('Title')['Age'].median()) \
  .rename(columns = {'Age': 'AgeFilledMedianByTitle'})
df = df.merge(medians_by_title, left_on = 'Title', right_index = True) \
  .sort_index(level = 0).sort_index(level = 1)
Have you noticed I used multiindex when creating df? Now, it’s simple to split it back!
df_train = df.ix['train']
df_test  = df.ix['test']
The purpose of featurize function above is to create dummy variables out of categorical ones. In Scikit we must be explicit about it as the algorithms accept only float variables.
def featurize(features):
  transformations = [
                            ('Embarked', LabelBinarizer()),
                            ('Fare', None),
                            ('Parch', None),
                            ('Pclass', LabelBinarizer()),
                            ('Sex', LabelBinarizer()),
                            ('SibSp', None),
                            ('Title', LabelBinarizer()),
                            ('FamilySize', None),
                            ('FamilyID', LabelBinarizer()),
                            ('AgeOriginallyNaN', None),
                            ('AgeFilledMedianByTitle', None)]

  return DataFrameMapper(filter(lambda x: x[0] in df.columns, transformations))
features = ['Sex', 'Title', 'FamilySize', 'AgeFilledMedianByTitle',
'Embarked', 'Pclass', 'FamilyID', 'AgeOriginallyNaN']
pipeline = Pipeline([('featurize', featurize(features)), ('forest', RandomForestClassifier())])The pipeline is a concatenation of transformer featurize and classifier forest.
Note, I used sklearn-pandas DataFrameMapper adapter to bridge sklearn and pandas in a seamless way. Now I can put Pandas data frames right into the pipeline to fit the model. No awkward jumping from Pandas and SciKit back and forth!
X = df_train[df_train.columns.drop('Survived')]
y = df_train['Survived']
model = pipeline.fit(X = X, y = y)
Note, that I put the pandas dataframe X and y directly, without explicitly transforming into numpy array.
I can reuse the pipeline for prediction and rely on pipeline to perform label binarizations the same way it was done for training.
prediction = model.predict(df_test)Fruits - model exploration
In R, some of these steps would be easier. For example instead of playing with dummy variables, one would simply use Survived ~ Sex + Title + FamilySize + ... + AgeOriginallyNaN and the algorithms would treat factor variables properly.
In Scikit we had to laboriously prepare the data and pipeline. Let’s see what laverage does it provide.
Modifying model
Creating a model with different set of features or different classifier is very simple.
simple_pipeline = Pipeline([('featurize', featurize(['Sex'])), ('lm', LogisticRegression())])
model = simple_pipeline.fit(X = X, y = y).predict(df_test)
Cross validation
Say we want to do k fold cross validation to validate our model. According to documentation this should perform a 3-fold cross validation.
cross_val_score(pipeline, X, y, 'accuracy')array([ 0.74747475, 0.8013468 , 0.82491582])
Looks good! How about k-fold stratified cross validation ?
stratified_kfold = StratifiedKFold(df_train['Survived'] == 1, n_folds = 10)
cross_val_score(simple_pipeline, X, y, 'accuracy', cv = stratified_kfold)
array([ 0.82222222, 0.83333333, 0.78651685, 0.87640449, 0.83146067,
0.79775281, 0.82022472, 0.78651685, 0.87640449, 0.85227273])
That impresses me!
Hyperparameters optimization
We have 3 algorithms implemented in Scikit to choose from. Let’s try Grid Search.
features = ['Sex', 'Title', 'FamilySize', 'AgeFilledMedianByTitle',
            'Embarked', 'Pclass', 'FamilyID', 'AgeOriginallyNaN']

pipeline = Pipeline([('featurize', featurize(features)), ('forest', RandomForestClassifier(n_estimators = 10))])

pipeline.fit(X, y).predict(df_train)

param_grid = dict(forest__n_estimators = [2, 16, 32], forest__criterion = ['gini', 'entropy'])

grid_search = GridSearchCV(pipeline, param_grid=param_grid, scoring='accuracy')

best_pipeline = grid_search.fit(X, y).best_estimator_
best_pipeline.get_params()['forest']
RandomForestClassifier(bootstrap=True, class_weight=None, criterion='entropy',
max_depth=None, max_features='auto', max_leaf_nodes=None,
min_samples_leaf=1, min_samples_split=2,
min_weight_fraction_leaf=0.0, n_estimators=16, n_jobs=1,
oob_score=False, random_state=None, verbose=0,
warm_start=False)
Turns out the best parameters are: n_estimators=32 and crieterion=gini.
Oh wait but how is it scored? The cv argument is unset, so we are at 3-fold cross-validation. Let’s try out stratified cross validation.
grid_search = GridSearchCV(pipeline, param_grid=param_grid, cv = stratified_kfold, scoring='accuracy')
best_pipeline = grid_search.fit(X, y).best_estimator_
best_pipeline.get_params()['forest']
RandomForestClassifier(bootstrap=True, class_weight=None, criterion='gini',
max_depth=None, max_features='auto', max_leaf_nodes=None,
min_samples_leaf=1, min_samples_split=2,
min_weight_fraction_leaf=0.0, n_estimators=16, n_jobs=1,
oob_score=False, random_state=None, verbose=0,
warm_start=False)
Oh, now we got criterion=gini but n_estimators=16.
If you want to verify that indeed stratified 10-fold cross validation was performed, you can set e.g. verbose = 10 as argument to GridSearchCV.
Interfacing with R
Last but not least structuring the code like I did above gives makes laveraging R using rpy2 very simple, as you have a R ready variables, mainly df, df_test and df_train.
I myself do that to plot using R’s excellent ggplot.
%load_ext rpy2.ipython
%Rpush df%%R
library(ggplot2)
ggplot(df) +
geom_bar(aes(Sex), stat = "bin") +
geom_bar(aes(Sex, fill = factor(Survived)), stat = "bin", position = "dodge") +
scale_fill_manual(values=c("#DD3333", "#33CC66", "#eeee00"))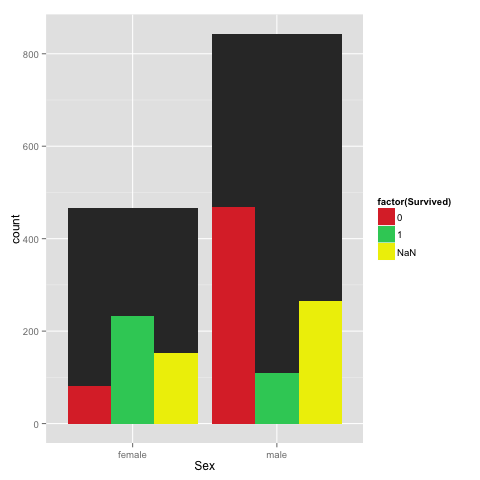
Summary
The last thing that I am missing in this picture is mapping between column names in pandas dataframe and column indexes in numpy arrays. That would be very useful if you want to e.g. display a tree from random forest for inspection.
Let me know if you know a way!